Managing Nmon Central Repositories
A common scenario of Nmon Splunk App resides in using the Application to manage large and massive collections of cold Nmon raw data that have been generated out of Splunk.
Topology example:
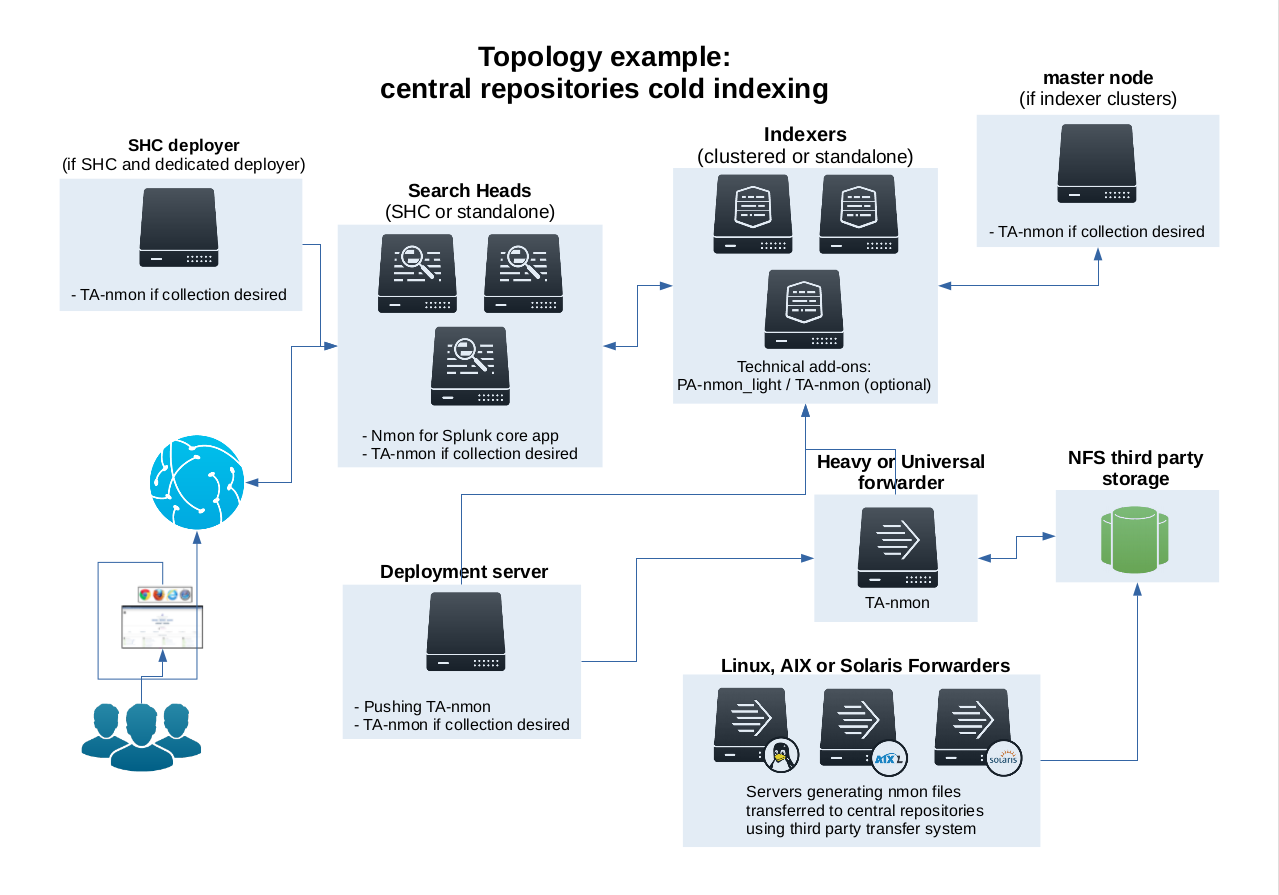
Such a configuration is quite easy to achieve, the only requirement is having a Splunk instance (Heavy or Universal Forwarder) having custom input monitors to watch for your Nmon files. (most of the time they would be hosted in NFS shares).
INFORMATION: The application can now manage cold and hot Nmon data even when centralized in a common place (see above)
Indexing Nmon data generated ouf of Splunk
The Application can manage multiple custom input monitors to automatically index your collection of Nmon raw data files:
It is important to create a custom input in a “local/inputs.conf” such that it does not get overwritten when the Application gets updated.
Here are some examples of monitor configuration:
[monitor:///mnt/NFS-SHARE/nmon-repository/*/*nmon]
disabled = false
index = nmon
sourcetype = nmon_processing
crcSalt = <SOURCE>
Or an alternative version using whitelist and manage any nmon files in sub folders:
[monitor:///mnt/NFS-SHARE/nmon-repository/]
disabled = false
whitelist = \.nmon$
index = nmon
sourcetype = nmon_processing
crcSalt = <SOURCE>
And even:
[monitor:///mnt/NFS-SHARE/nmon-repository/.../*.nmon]
disabled = false
index = nmon
sourcetype = nmon_processing
crcSalt = <SOURCE>
If you are synchronizing HOT nmon data:
After adding the input, please restart Splunk.
Immediately after restart, the App should start managing available Nmon files, look in the nmon_processing sourcetype to get the current activity of the Nmon processing steps:
index=nmon sourcetype=nmon_processing
Or open the report: “Activity of NMON Data Processing”